Linear Gradients between multiple colours provide you with a possibility to take your design to the next level. Being able to define the amount, spacing and colour of a Gradient, one can customize anything, from backgrounds to visual elements on your screen.
The standard and easiest way Canvas enables you to create a gradient, is to use a prebuilt method such as JavaScripts createLinearGradient(). This method creates a linear gradient parallel with a line provided by the X/Y-Coordinates of two given points.
Hard-coding two specified Points is possible but doesn’t allow for easy adjustability. The goal of the following Methods was to automatically create a linear Gradient that is rotatable, at any given angle, inside a rectangle of any size and aspect ratio, using as little input as possible. This Post shows multiple ways to tackle this problem.
Approach 1.
Approach one divides the rectangle into five sectors, in all of which the movement of the points “P1” and “P2” are limited to only a single variable. After establishing which sector, the angle (therefor the point) is currently in, the coordinates can be calculated using simple triangulation.

Because we are dealing with a normal rectangle with four sides and perpendicular corners, all we are doing is projecting a vector from the Middle of our Box to one of the four edges and mirroring that point across to the other side.
The first step is to calculate the four angles at which our vector will point straight into the corners. Calculating these is very simple using basic geometric algebra (“Corner Angle 1”, as shown above), also this part of the code, only has to be run once. We can then write cases for each one of these angles giving our two points the known X/Y-Coordinates (e.g. (0, 0) or (0, width)).
After we have the four angles, we can setup if-cases, determining on which line our point is currently moving. As shown in the image we need to divide the rectangle into five sectors. “Sector 1” and “sector 5” have to be separate because of the way we define angle 0. The documentation asked for angle 0 to be located pointing directly upwards, therefore an additional rotation of the tangent function of 90° was necessary. The tangent of 90° is equal to ±∞ resulting in the need for an additional case at “Angle = 0”.
Defining these if-cases in JavaScript is also simple: we know that if the “Angle” is between 0 and “Corner Angle 1”, the point will be moving along “line 1” which means the Y-Coordinate stays constant. If however, the angle is between “Corner Angle 1” and the second diagonal (= 180° – “Corner Angle 1”), then the point is on “line 2”, meaning the X-Coordinate stays constant and so on. All that is left to do is to calculate the non-constant coordinate and overwrite the existing point values.
We now have one of the points moving along the rectangle border dependant on the current angle (shown in white). Using point symmetry to our advantage, all we need to do, to find the second point, is to rotate the existing values by 180° (shown in black).
Approach 2.
A different approach to the same problem would be to create a mathematical function: f(x):=tan(angle)*x. This results, if plotted, in a straight line inclined at our set angle. We now calculate the intersection of our f(x) function with the four edges of the rectangle. This point returns X- or Y-Coordinate values from +∞ to -∞ depending on the set angle and edge.
kx = (midWidth - Math.tan(angInRad) * midHeight);
ky = (midHeight + ((width - midWidth) / Math.tan(angInRad)));
jx = (midWidth + Math.tan(angInRad) * (height - midHeight));
jy = (midHeight - (midWidth / Math.tan(angInRad)));
For example, on line 3 (referring to the Image in Approach 1), we know that the value calculated is the X-Coordinate, meaning the Y-Coordinate is constant. This results in the point having the coordinates: x = jx, y = height -> (jx,height). This point is shown as a yellow box.
We need to check, using an if-method, which of the calculated points are relevant to us. By knowing the set width and height of our rectangle we can check if our values are between e.g. 0 and width and therefore currently a part of the rectangle border. If this is the case we can set a Boolean value to “True” for being inside- and for “False” if being outside of the rectangle border.
For 99% of cases, there will only be two points set to a “True” value at a time. The remaining 1% occurs when the function f(x) is pointing straight into a corner. For these exceptions, we need to define cases, manually setting the coordinates for the two points.
The remaining function is simple, all it does is it connects the 2 visible points. Now if we draw a line between the points and change or even animate the angle all seems to work just fine. But if we attach the gradient to this line we see that it only moves half a rotation before snapping back to where it started. This is due to the periodicity of the tangent function. To counteract this behaviour, we need to swap the X- and Y-Coordinates every time the gradient would jump. By analysing the equations: kx, ky, jx and jy, we know that the jump occurs when f(x) points to the upper left-hand corner. A method is needed to swap the coordinates, each time this certain angle is reached (the angle can be calculated as seen above in “Approach 1”).
A slight variation of Approach 2.
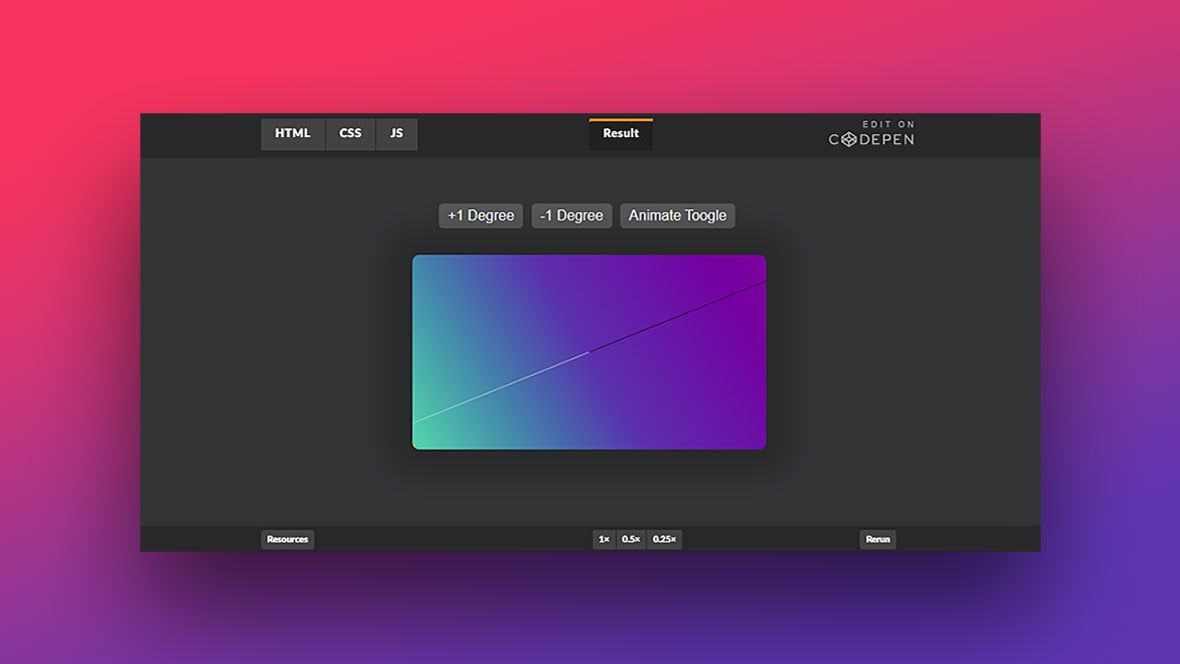
Another interesting concept would be, to be able to move the centre of the gradient to anywhere inside the rectangle, possibly even to animate a rotating motion of the linear gradient within Canvas. Thankfully we already have everything we need in Approach 2. All we have to do is to change each variable: “midWidth”, “midHeight” to new variables, so that we can control these values from outside of our function using CSS Buttons. The coordinate (midX, midY) defines the centre point of the rotation, by changing these values we can move the linear gradient anywhere. Boundaries for these values have to be set according to the width and height of the rectangle. It is possible to move the centre point outside of the box, but modifying the equations, used to calculate the coordinates, must be done first.
Unfortunately, in this method, we encounter the same gradient-jumping problem as mentioned above, with the difference being a slightly harder fix. Because we are comparing the input angle and the calculated angle, at which our function f(x) is pointed towards the corner, we are sometimes getting around half a degree of movement in undefined space. Notice that this effect tends to happen more often when the centre point is moved to the Right side of the Box. Our input degree angle only consists of natural numbers (e.g. 1,2,3,…), this means that a 1° step results in a larger change to the Y-Coordinate on the left side than on the right given the centre point is also on the right side. The point at which our function has to switch sides is the top left corner. If the centre point is towards the left side, the resolution of the steps in the top left corner gets better (increments between Y-Coordinates decrease), allowing for much smaller or even non-existent errors.
The opposite can be seen if the centre point is moved towards the right. As the steps between Y-Coordinates get larger, the resolution of plotted points around the top left corner gets worse. Due to the used JavaScript Math.round() method for rounding the Angles, the lack of precise points results in premature switching of the linear gradient – a jump. Here this effect is left on purpose to visualize the “jumping” artefact and to better understand the Math.round() problem (when moving the centre point, not all positions trigger this behaviour).
Countering this Problem would take some slight modifications. By lowering the rotation speed, the resolution of points towards the top left corner increases, allowing for fewer jumps. An even better way would be to create a method, that checks the nearest reachable point to the (0,0) coordinate and sets the gradient-switching case parameter to that value. This way any fluctuations can be cancelled out because the if-case is always comparing the Y-Coordinate to the precise value of the last reachable point.
Conclusion
So now that we’ve looked at both possibilities, what is the difference? Which one is better?
Well that depends, for a normal rectangle without the animation of the Gradient both approaches deliver the same results, the only difference is in the length of the code, and therefore the time it takes to compute. However, the main difference lies in the expansion options of the second approach. This solution could be adapted to all sorts of shapes and sizes without a lot of difficulties as it already uses a “connect the points, if these are currently visible” algorithm.